GitHub Graphs功能介绍
在 GitHub 中,Graphs 页可以通过 4 种图表查看该仓库的相关统计信息(图1)。利用图表直观地汇总信息,可以让用户把握当前仓库的各种趋势。下面,让我们来了解一下每个图表所包含的信息。
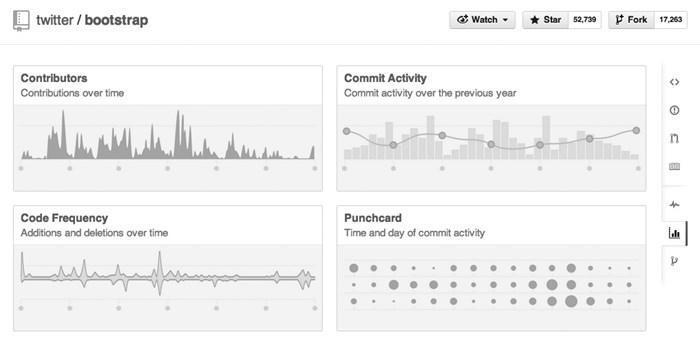
图1:Graphs
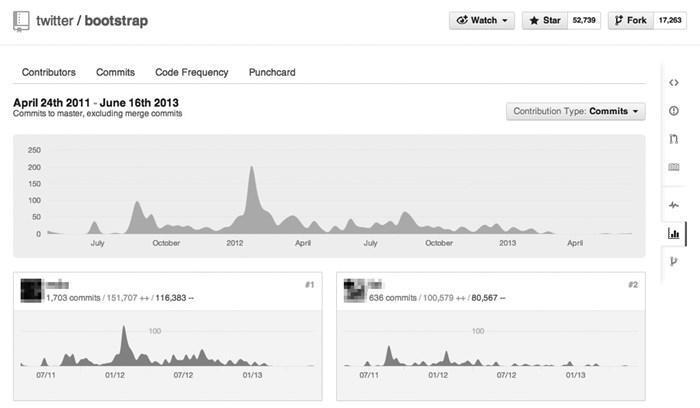
图2:Contributors
另外,这些图表的统计中还包括发送 Pull Request 被采纳后产生的代码增减。
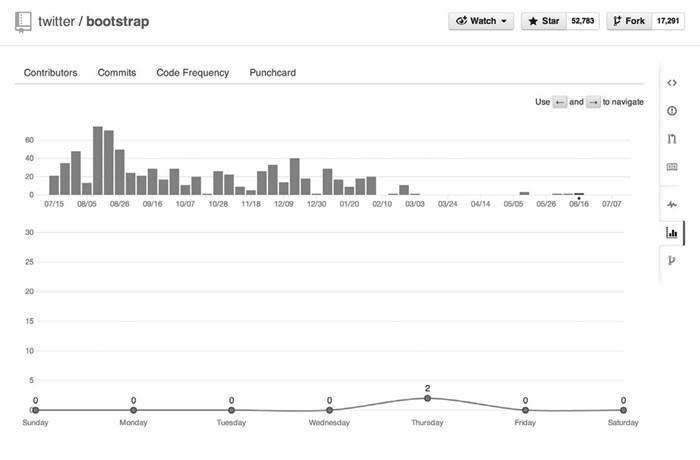
图3:Commit Activity
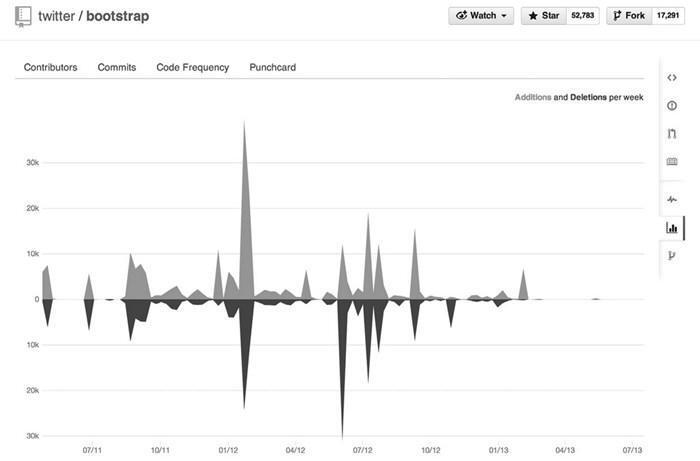
图4:Code Frequency
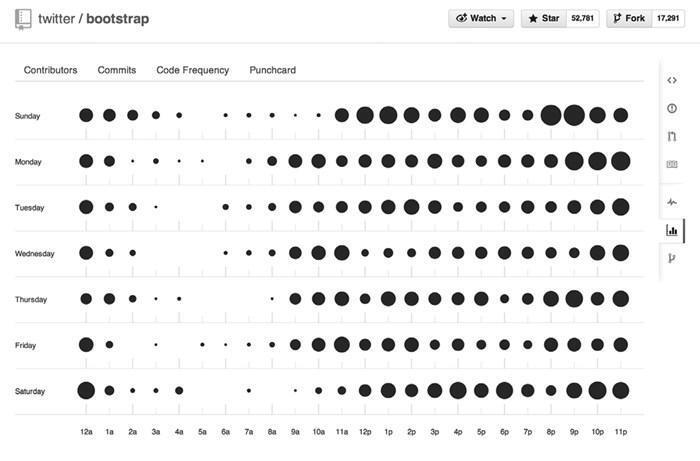
图5:punchcard
仓库的关键人物往往会出现在提交频率高的时间段,因此用户发送的 Pull Request 最有可能在这段时间内被处理。大致了解时间规律,将有助于各位把握好发送 Pull Request 以及等待回复的时间点。另外,该软件的开发是集中在早上还是晚上,从这张图中也可一目了然。
图1:Graphs
1. Contributors
在 Contributors 的图表中,我们可以看到每个用户在相应日期中发送提交、添加代码、删除代码的大致数量(图2)。从这里我们能够了解到该仓库的代码主要由哪些人编写。而且,还可以通过图表分析出该软件大幅修改阶段和稳定维护阶段的相应时期。图2:Contributors
另外,这些图表的统计中还包括发送 Pull Request 被采纳后产生的代码增减。
2. Commit Activity
Commit Activity 中显示了一年内(52 周)每周收到的提交的大致数 量(图3)。第二张表中还可以查看相应周每天的提交数量。判断某个仓库是否有人在积极更新时,这部分是一个重要的指标。图3:Commit Activity
3. Code Frequency
Code Frequency 中显示了该仓库中代码行数的增加量和删除量(图4)。一款优秀的软件并不会一味地增加代码,在经过重构之后,代码量往往会降低。通过这张图,我们可以直观地把握相应信息。图4:Code Frequency
4. Punchcard
从 Punchcard 的图中我们可以直观地掌握一周内每天何时收到的提交最多(图5)。黑色圆越大,表示提交越频繁。图5:punchcard
仓库的关键人物往往会出现在提交频率高的时间段,因此用户发送的 Pull Request 最有可能在这段时间内被处理。大致了解时间规律,将有助于各位把握好发送 Pull Request 以及等待回复的时间点。另外,该软件的开发是集中在早上还是晚上,从这张图中也可一目了然。
 ICP备案:
 公安联网备案: